Your first Power Index for trading ES E-Mini futures
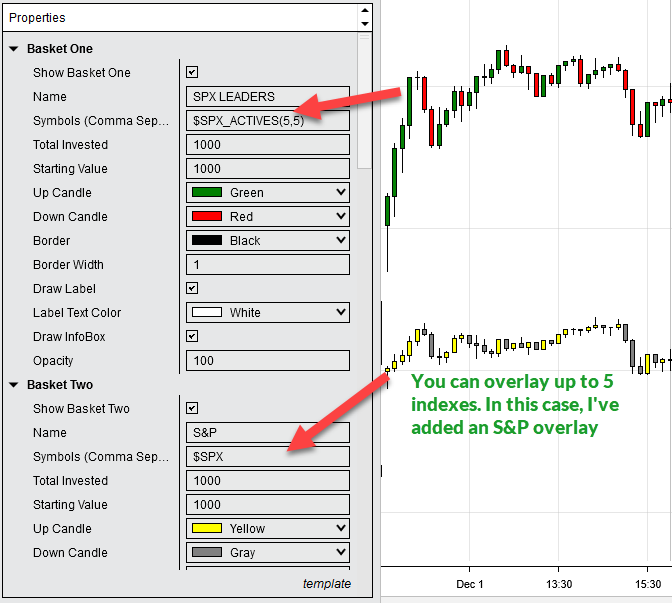
Build a real time Index of the 5 most impactful stocks on your ES position over the last 5 days. Enter the following into a CapWeightedIntraday Indicator:
Now make one for trading the NQ E-Mini
If you trade NQ E-Mini Futures, just replace "SPX" in the example above with "NDX" like this:
$NDX_ACTIVES(5,5)
It also works with any of the major Sector Spyder© ETF's:
| Symbol | Sector | Example |
|---|---|---|
| {{etf.symbol}} | {{etf.description}} |
Important
Power Indexes are only for use with the CapWeightedIntraday Indicator. Trying to use them in other Indicators will likely cause an error.
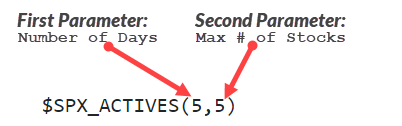
Altering the Parameters
First Parameter: Number of Days
In the examples above, I've always used 5 for the Number of Days parameter, however you could use 2,3,5,7,10 or 14.
Second Parameter: Maximum number of stocks to return
The maximum value is 12 but for the ES and NQ, I frequently use 5. You can also enter this parameter with a percent sign behind it like this:
$XLK_ACTIVES(14,20%)
In the example above, the first parameter is 14 days. The second parameter means that stocks get added to your index starting with the most impactful over this period, until the Market Cap. of your index is atleast 20% of the size of the total Market Cap. of the Technology Sector, (ticker XLK in this case).
Use them in Spread calculations
$XLK_ACTIVES(14,5)|-XLK
Using the Pipe operator ("|") creates a 50/50 spread between the instruments you put on each side of the Pipe. In this example, we build a spread between the 5 most impactful stocks in the Technology Sector over the last 14 days, and the XLK index itself. Basically what we're looking at is the expansion and contraction of the movers and shakers vs. those stocks that aren't doing much. This example also demonstrates that you can use reqular stock or ETF symbols like XLK or AAPL in your calculations with other stocks or Power Indexes.
You can also add Power Indexes together
$XLK_ACTIVES(14,2),$XLC(14,2),$XLV(14,2)
This example adds the 2 most active stocks from three different sectors by simply building a comma separated list of Power Indexes. In total, there would be 6 stocks in this index and each stock would automatically be weighted according to its weight in the S&P at yesterdays close.
Visualizing a Sector without its' leader
XLK,-$XLK_ACTIVES(14,2)
This example would subtract the two most active stocks in the Technology sector from the Technology sector. This is very useful if you want to see the performance of a sector without its' leaders. This looks like the Spread example above but without the pipe operator. The main difference is that the pipe operator signifies to make a 50/50 investment in each side. Without the pipe, we subtract the the two most actives using their weight in the index. For example, assuming the two most actives below held a weight of 10% each in the XLK index, we would build an index containing an 80% long investment in XLK and a 20% short in the 2 most actives.